How to build a Funnel in Data Studio?
Add a funnel to your Data Studio dashboard in 4 simple steps


Step-by-step
More detailed step-by-step overview
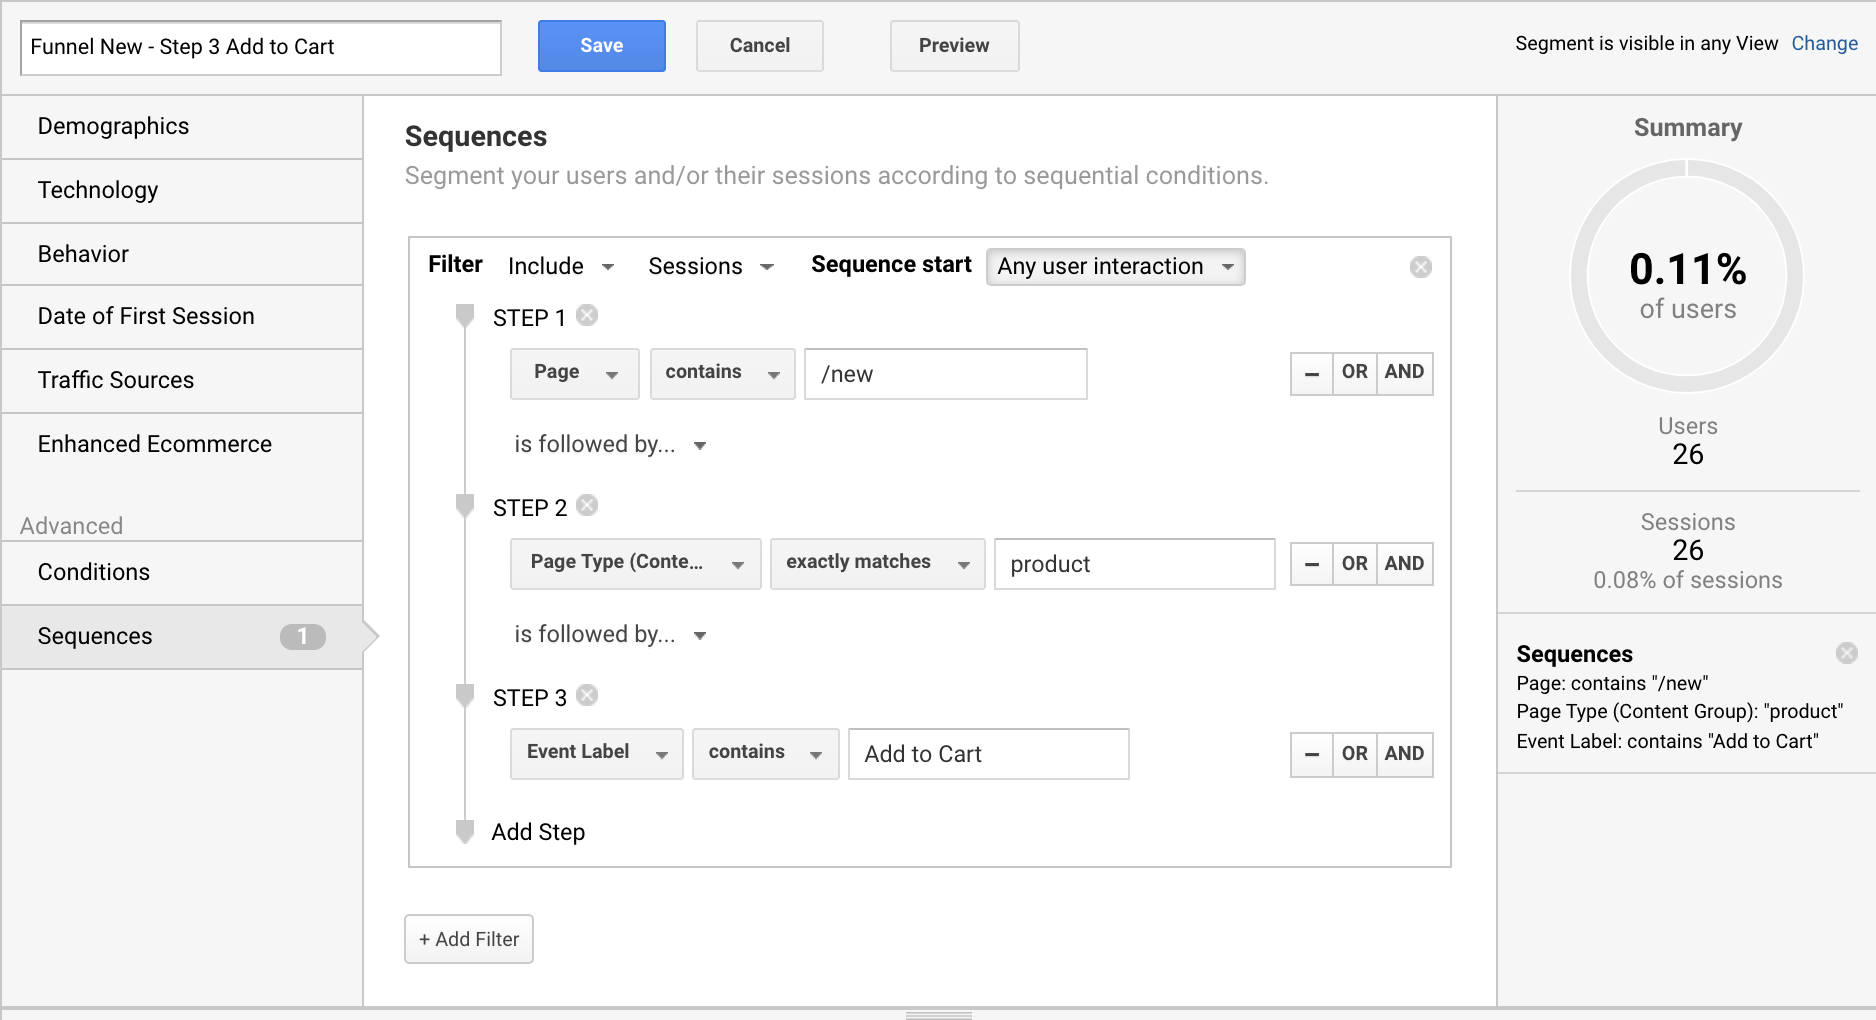
Create Segments in GA
Each Google Analytics segment represents a step in your funnel. There are no restrictions from the FunnelGraph connector, except for the "Combine Segment" feature, which may generate an API error. We still working hard on improving this functionality and are thankful for your patience.

Add FunnelGraph Connector
To add FunnelGraph Connector to your Data Studio account, please click on "Create" -> "Data Source" on the top left corner. Type "FunnelGraph" in the search bar to filter the extension list and click on "Select" to add the Data Source to your account.
During the approval process, please use the following button to add the FunnelGraph Connector manually.
Authorize Your Account
In order to start using the connector you will require to authorize your account twice: first for Data Studio using community connector, second to authenticate in order to use the functionality of the connector. Your account will be created automatically, after the second step authorization.
We care about data privacy and don't use your information for any marketing purposes until you provide explicit consent by signing up on https://my.true-m.com. Once you decide to upgrade your account and unlock the premium features, please use the same Google E-Mail to authorize your account.


Basic Settings
After adding the connector, you will be able to select a Google Analytics property, as well as use the segments associated with your account to select the Funnel steps.
If the segment you are looking for is not available in the list, please try the following solution:
- Click on "Connect" / "Reconnect" on the top right corner and come back to the settings in order to update the list with segments
Trial accounts are also limited to one funnel only. In order to make the settings editable per each report, please upgrade your account to Premium version.
Easy replication by creating segment conditions dynamically
Use case: Build a report to monitor drop off rate for the 3 steps sales funnel for the top 10 categories.
To build this kind of a report you will require 3 (steps) X 10 (categories) = 30 (segments). If your sales funnel changes all 30 segments need to be updated. If your sales funnel increases from 3 to 5 steps, the number of required segments increases up to 50. Maintenance and potential errors increase exponentially.
By using the FunnelGraph dynamic segment option you just need to create 3 segments that would represent the sales process and 10 separate segments to enclose each category, in total 13 segments.
In the report, you will then assign each segment to the representative funnel step and replicate the settings by just changing the option "Apply segment(s) to Funnel" for each category.
Benefits:
- Adding new steps to the funnel is easy > all settings in one place
- Easy maintenance because of no redundancy > condition for each step exist just once
Previous steps conditions to generate segment steps on-the-fly
Use case: 7 different 6-steps funnels have similar conditions, except for step #2 and #5, which are different for each funnel.
To build up this funnels, all 7 funnels needs to be created separately, in total 7 (funnels) X 6 (steps) = 42 (segments). Maintenance increases over time.
By using the FunnelGraph connector, you can use the conditions of the previous step to apply the condition for the next. In this case, you only need to create 4 segments that cover the similarity across the funnels and 2 segments per funnel to cover the differences, in total: 18 segments.
Benefits:
- Easy replication to new funnel
- Lower level of complexity which increases stability
Add funnel visualization to your dashboard
Out of the box, FunnelGraph connector provide two funnel chart visualizations, which can be used with all available connectors in the marketplace.
During the approval process, you can add those visualization manually by following the settings described in the image on the right and by using the following ids:
- FunnelGraph: gs://true-metrics-funnelgraph/graphviz
- 3DFunnel: gs://true-metrics-funnelgraph/d3funnel
More details to the settings coming soon
