DIGITAL ANALYTICS

3 steps where Web Analytics drives Digital Transformation to success
Digital Strategy
Digital Transformation
The importance of Web and Mobile Analytics in the Digital Transformation process should be almost obvious for any kind of digital business. Especially in the data-driven business world, having Google Analytics or any kind of analytics system installed to measure not only the website performance but much more any kind of interaction between your customers or your employees and your business.
But still, many times the foundation of a digital transformation is based on people's feelings, rather than being driven by conclusions coming from the collected data. Not to mix up with the vision, which indeed needs to inspire people emotionally. Moreover, the directions in order to achieve Successful Digital Transformation has to be Data-Driven, especially in digital businesses.
During Digital Transformation the company uses digital technologies to create or modify business processes, the culture, and/or the products and services to meet the business goals. Certainly, the Digital Transformation is not just improving SEO or adding a CRM system to the business. The ultimate goal would always begin and ends by improving the processes around Customer Experience to add value to every customer interaction. This fact specifically differentiates Digital Transformation from Digitization or Digitalization.
In order to implement the changes successfully, the process needs to be lead and managed. One of the models which would help to apply Digital Transformation successfully is "The 8-Step Process for Leading Change", cultivated by Dr. Kotter. Web and Mobile Analytics can provide significant information in order to move from one step to the next and be an essential part of the decisions making process, especially for the following 5 steps.
Create a Sense of Urgency
Assuming that business processes will be changed during Digital Transformation, a lot of resistance may occur especially if the business is already profitable. To underline the importance of initiating the change, Web Analytics reports helps not only to show the current situation, much more underline the opportunity the company is losing every month at the moment by not having the right processes on the place. Going further, most Web Analytics systems already going beyond the online world and provide tracking capability to merge customer experience between online and offline worlds.
Few KPI examples from the retail section below:
- Increase/Decrease in Traffic Performance vs. Sales Performance (online & offline)
- Increase/Decrease in Marketing Spendings vs. Conversion Rate
- Increase in Customer Support expenses vs. Success Rate
Forming a Strategic Vision and measuring Short-Term Wins
By always keeping in mind, Digital Transformation needs to add value to each customer interaction, all the approaches have to be aligned with and evaluated based on the Strategic Corporate Vision. By fulfilling the emotional part providing the inspiring vision for the companies future, a data-driven perspective should always be a part of managerial approaches during the process. By breaking down the goal into separate KPIs and adjusting the value, the whole process became measurable up to the macro level.
Tools to measure short-term wins:
- Google Data Studio
- Adobe Analytics Workspaces
- Power BI
Sustaining of the Acceleration Instituting Changes long-term
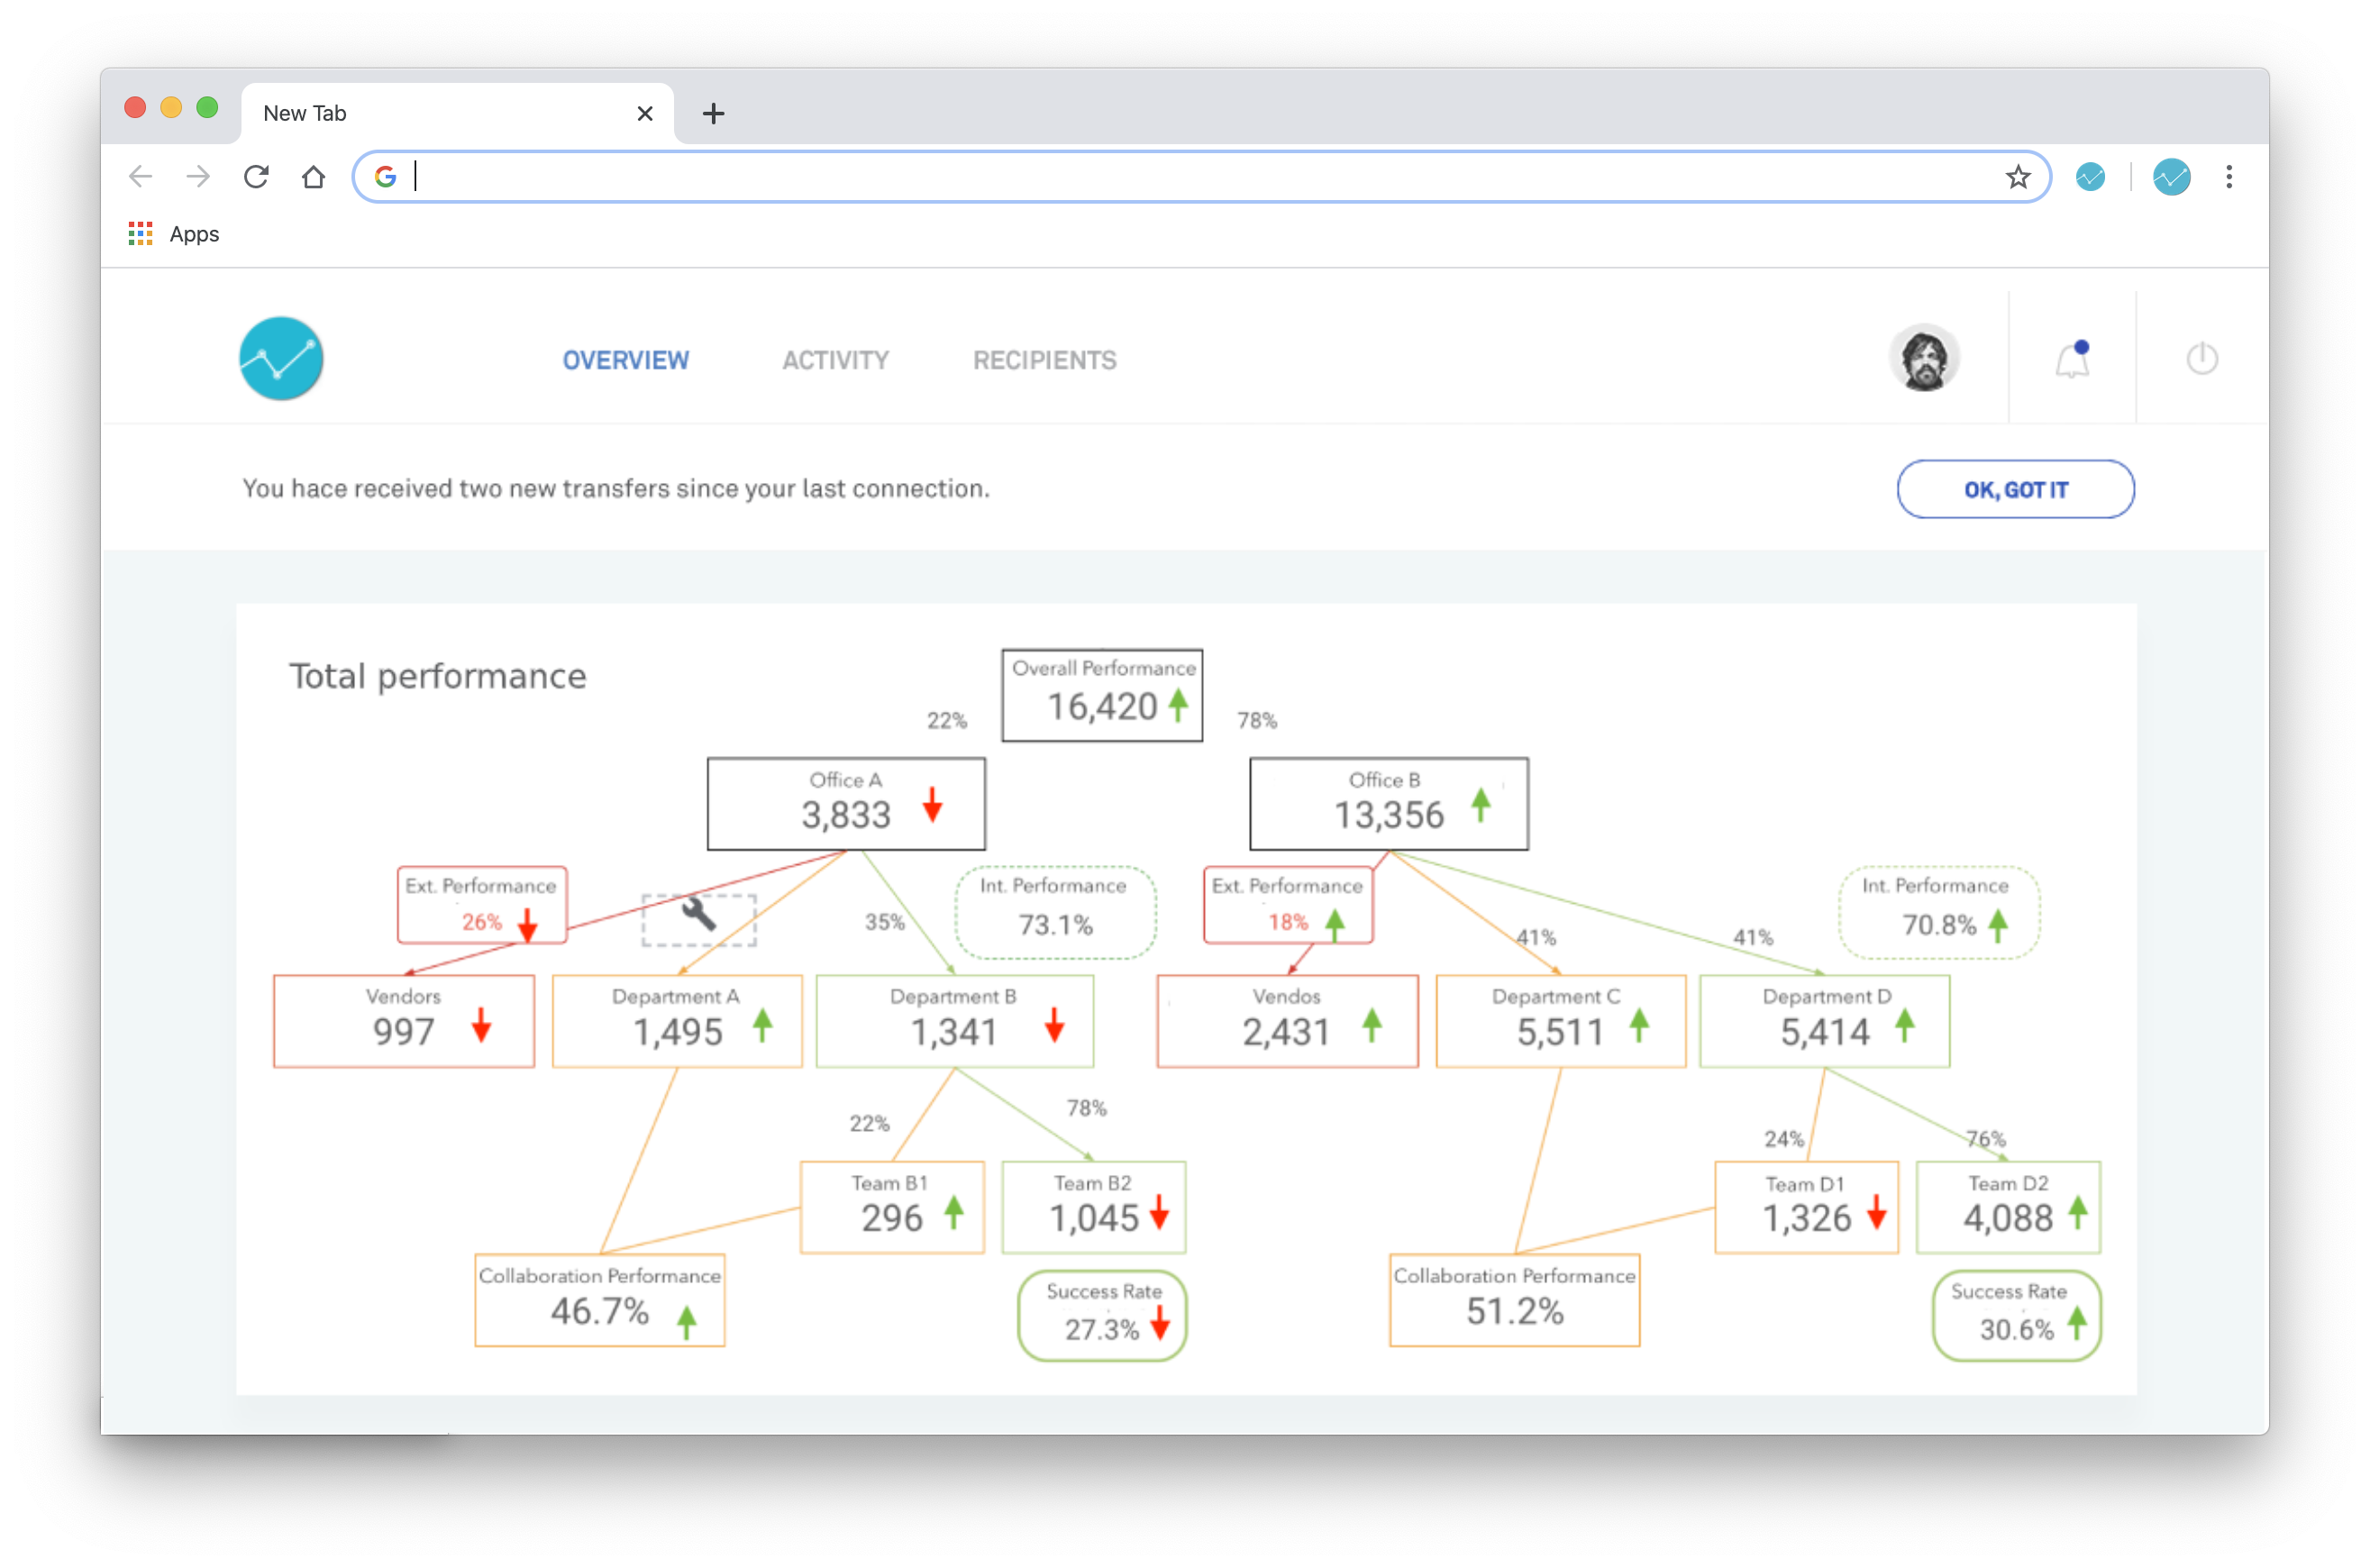
Different types of reporting across all levels of management inside of the organization make the process sustainable up to the macro level. The Data-Driven Digital Transformation approach always includes the evaluating of macro-level KPI, which can be broken down to department levels, the transformation process can be measured on a very detailed level.
Techniques to sustain the acceleration for long-term success:
- Instituting data-driven approaches as part of all, even small projects
- Always providing a KPI to evaluate the project success
- Instituting the KPI performance evaluation on a daily or weekly basis
An example to build a tree diagram in order to evaluate different departments as KPIs to the overall success:
