FUNNELGRAPH
FIND WHERE YOU LOSE CUSTOMERS

SEE HOW IT WORKS
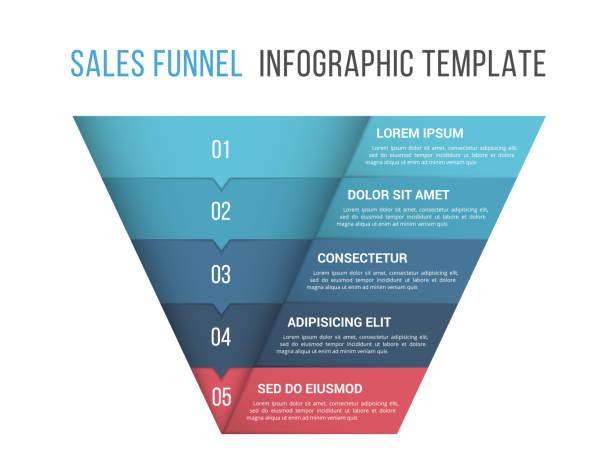
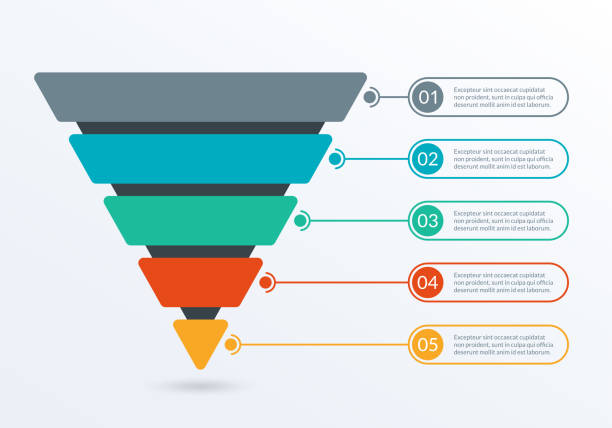
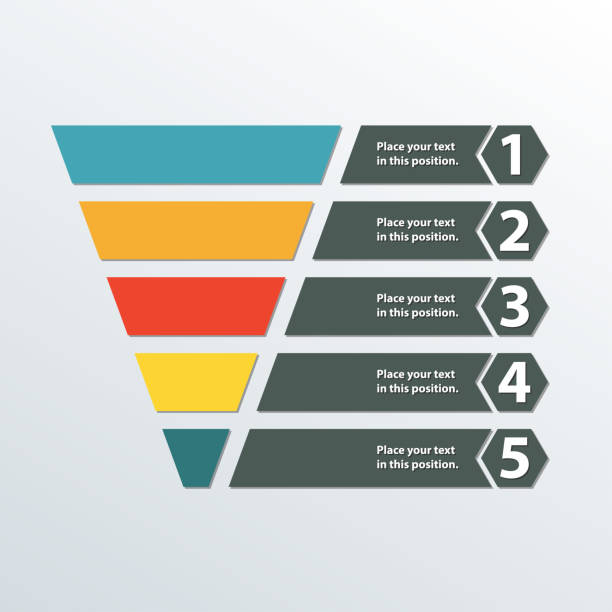
Funnels are powerful!
... but building funnels in Google Analytics can be annoying. We are here to show you a better way!
Customer journey, sales and marketing funnel, visualize the path users are taking quickly and easily by using FunnelGraph in Data Studio. Find drop-offs quickly, maximize your conversion rate, get a simple way to identify the leaking point in your process.
FunnelGraph uses the data from your Google Analytics to build segments in realtime and show the results in powerful and dynamic funnel visualization.
Trial
- No expiration date
- Funnel with up to 3 steps
- Build conditions in real-time
- Drop-Off calculation
- Limited to 1 Funnel per Account
FAST AND RELIABLE
BASED ON YOUR GOOGLE ANALYTICS DATA
Premium
- Funnels with up to 10 steps
- Premium visualizations
- Customized support
- Custom picked use cases
- Unlimited funnels per Account
- High amount of pre-build materials
We respect your privacy & information


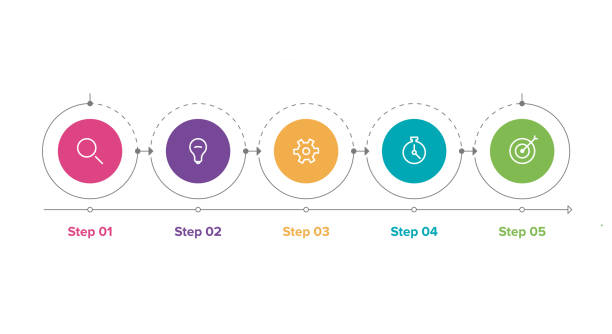
How can FunnelGraph help you?
Solutions
For Marketers
For Analysts
For Agencies
For Product Owners
For Startups
For Businesses
WILL FUNNELGRAPH WORK FOR YOU?
Case studies


50+ templates
100% GDPR conform
Money-back guarantee
WHAT MAKES FUNNELGRAPH SO POWERFUL?
INTERACTIVE VISUALIZATIONS
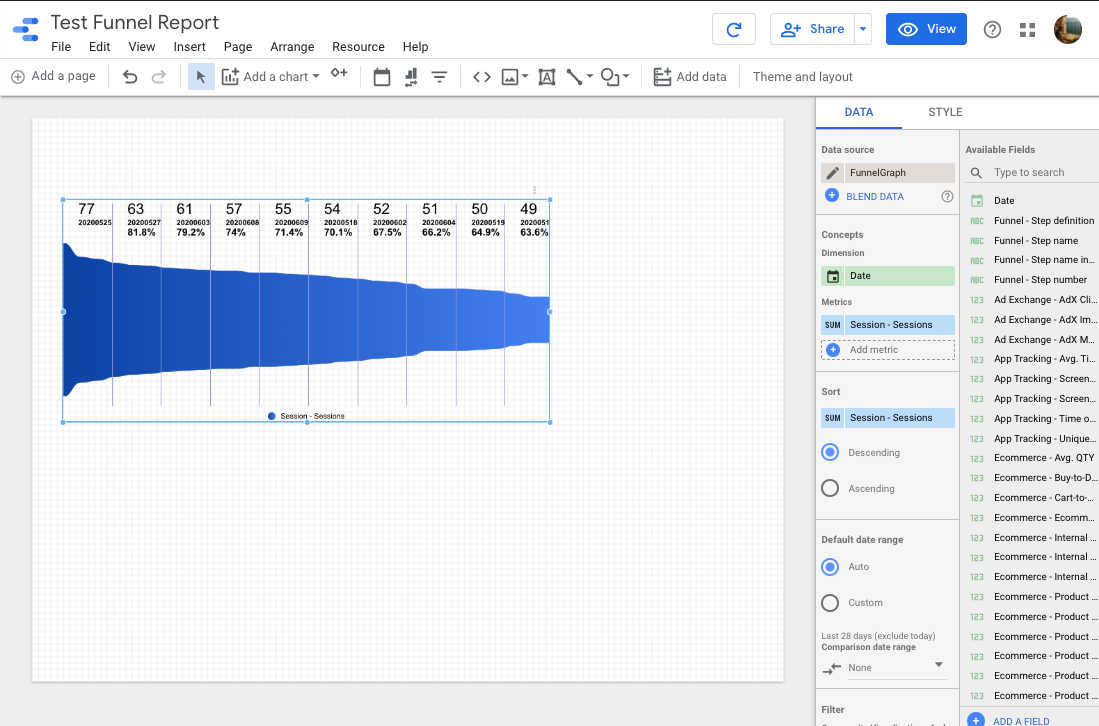
The funnel view is one of the best ways to identify leaks in your customer journey. Ultimately, the goal is to increase conversions by using a funnel view, which helps you home in on the exact stage in the journey that’s causing the most dropouts.
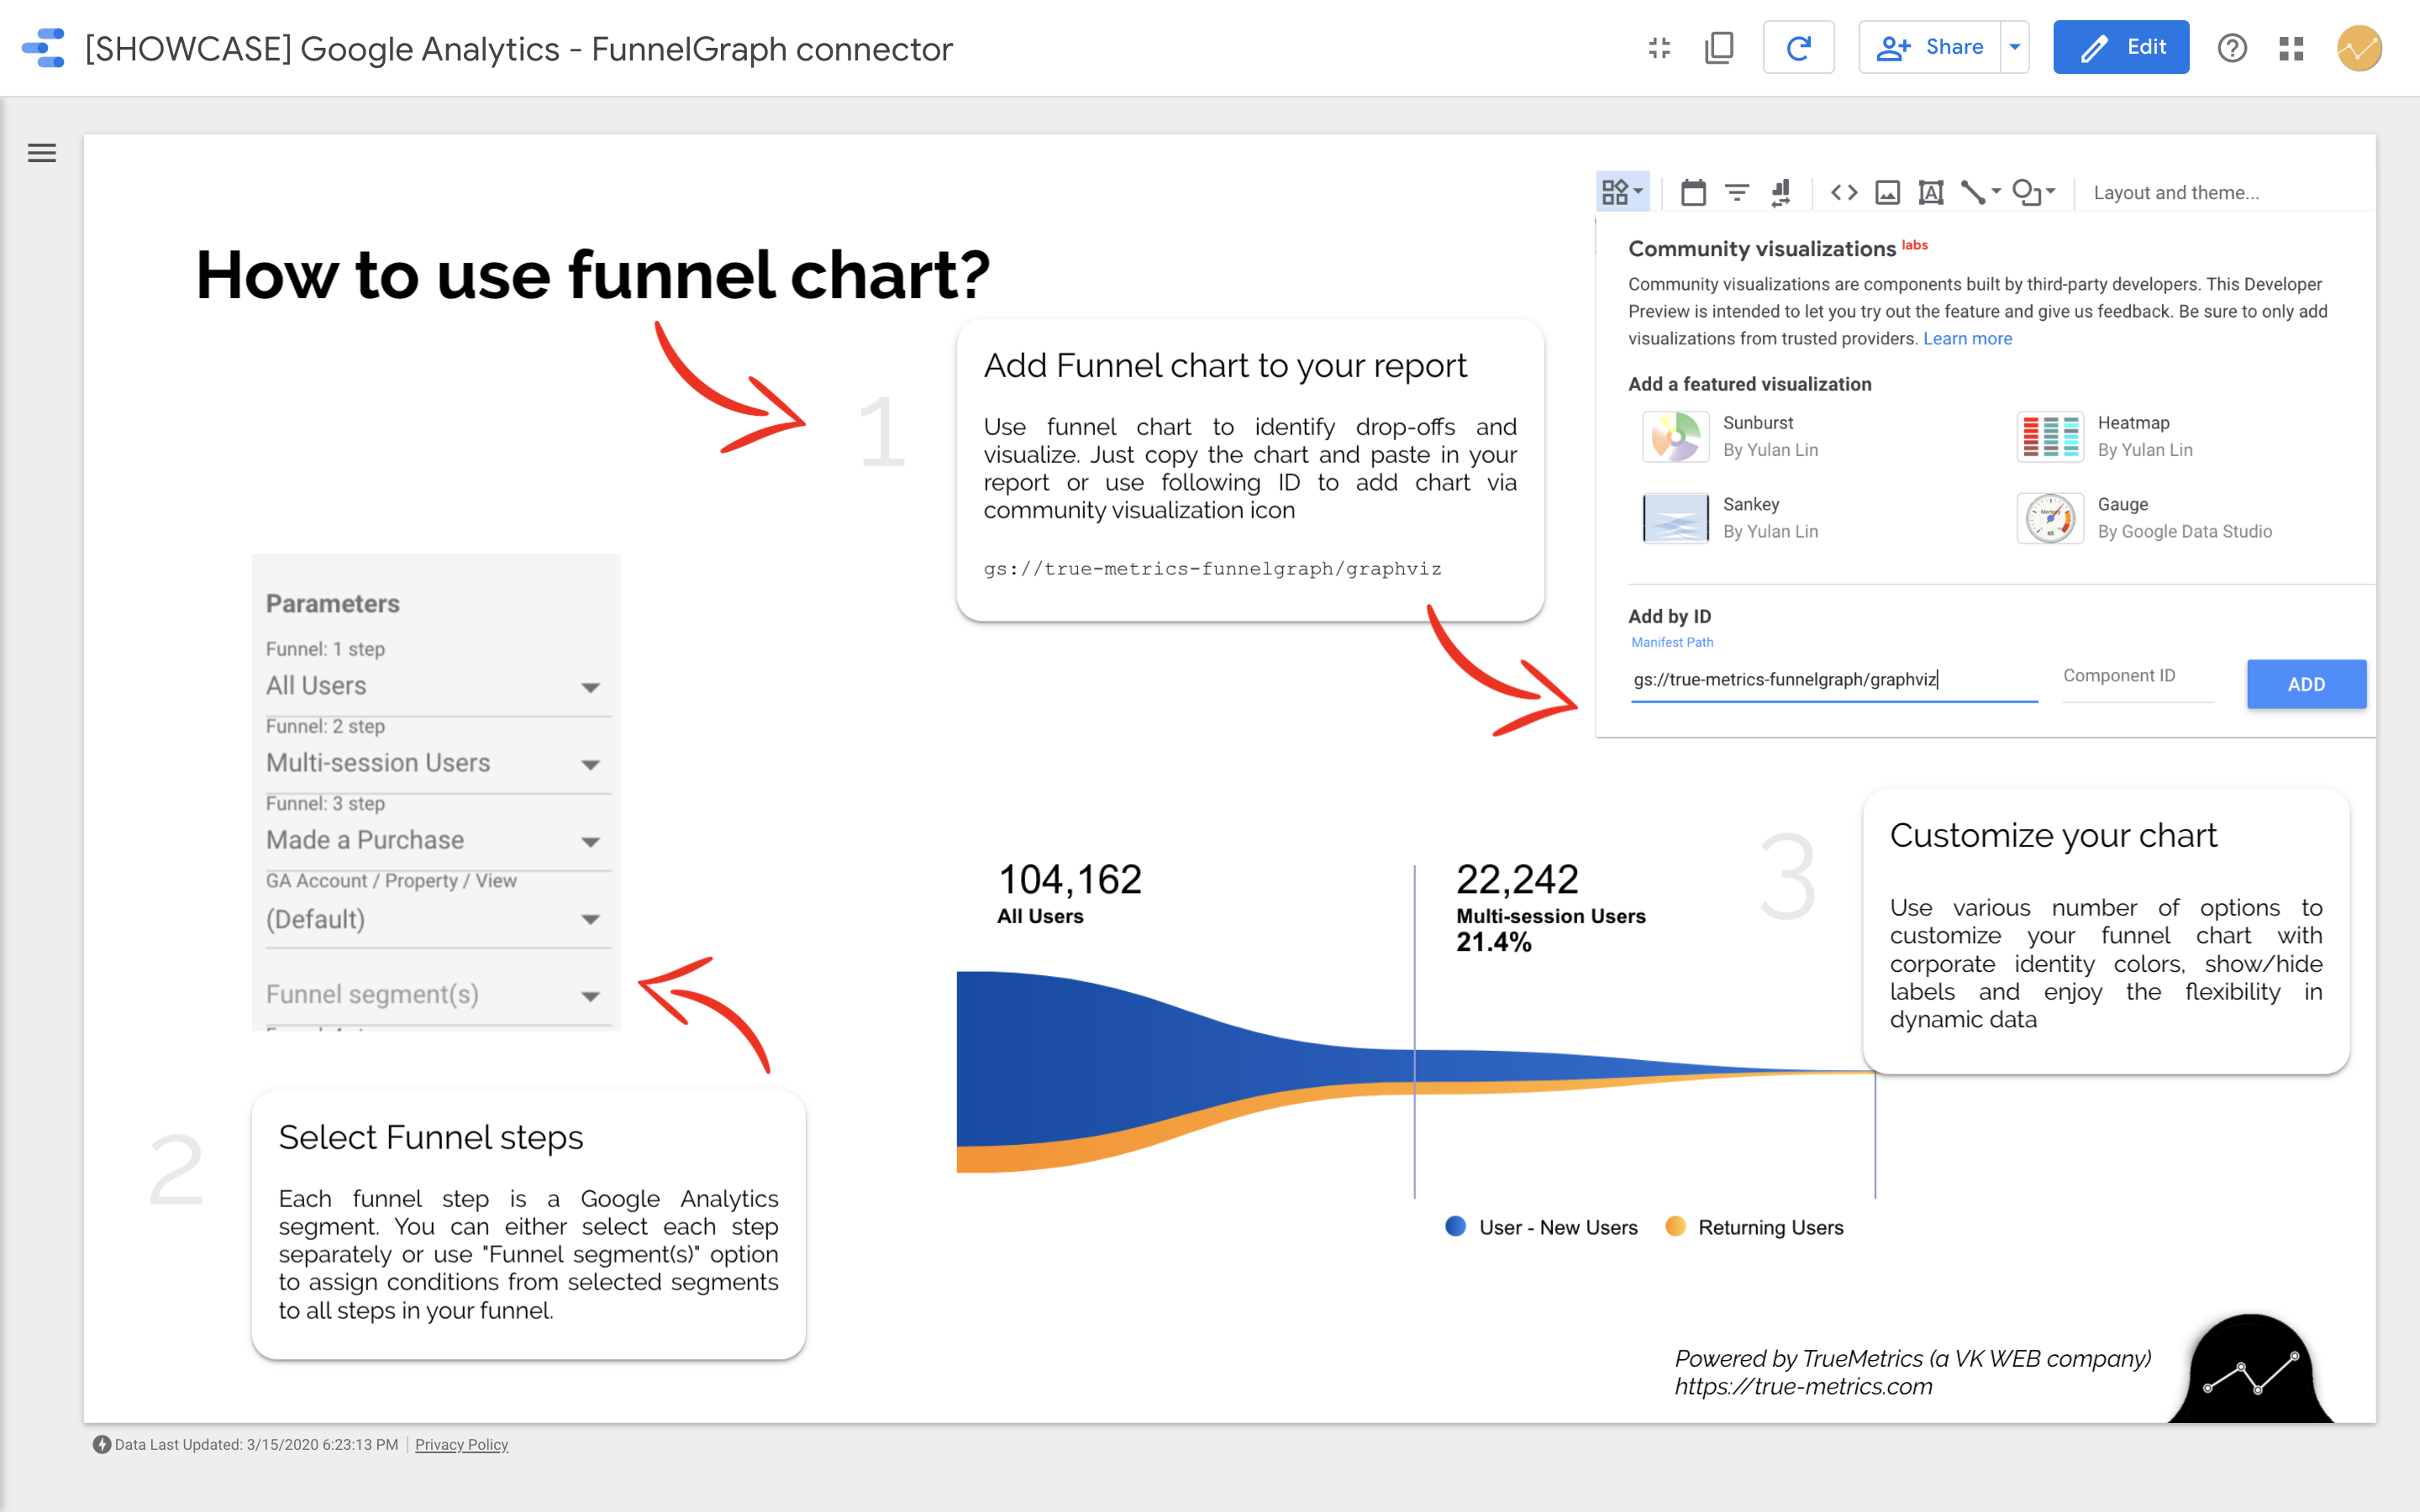
Funnel Graph connector uses a free Data Studio Visualization "d3-funnel Graph". The d3-funnel is an extensible, open-source JavaScript library for rendering funnel charts using the D3.js library and focused on providing practical and visually appealing funnels through a variety of customization options.
Follow the link to see more information about the available funnel charts.
RETROSPECTIVE CALCULATION
By using Google Analytics Segments, you can visualize the funnels for all historical data your Google Analytics property already have collected. FunnelGraph uses the segments to transform the results in a way Data Studio requires information to present. This allows to visualize the path your customers taking to achieve goals.
You don't need to learn anything new except how to build a segment in Google Analytics, in order to be able to build the funnel visualization with FunnelGraph. The process is simple: just create sequential segments and use them in the FunnelGraph connector in a flexible order. The functionality is not only limited to sequential segments, you can use any kind of segments to provide behavior visualization in relation to any flow.
100% GDPR CONFORM & DATA PROTECTION
No caching, no 3rd-party storage, all data is coming straight from the Google Analytics API. Your credentials will be securely stored and managed by Data Studio out-of-the-box, we never have the capability to access your or your client's data period.


ADD FUNNELGRAPH TO YOUR DASHBOARD
Add the FUNNELGRAPH to Data Studio by clicking on the following button. Once you authenticated successfully, you can use a free trial version for unlimited amount of time.
To start using the funnel visualizations, please follow the instructions by clicking on the linked image right to the text.
Even more features ...
Thanks to layout customization options Funnel Graph provide lots of features to make your analysis easier.
Your data can be reported with almost any standard Data Studio visualization, but to improve your insights you can take advantage of our custom-created funnel visualizations FunnelGraph and 3DFunnel.
- Build-in percentage calculation for value and drop-off rate (no custom metric required)
- Flexible label layout by using placeholder structure
- Customizable Tooltip functionality for providing detailed information
- Settings like dynamic color calculation, width, height, and many more options provide even higher layout flexibility
Stay tuned, we are working hard to provide you, even more, features soon …
New visualizations coming soon...